Why is Novartis stock tumbling today?
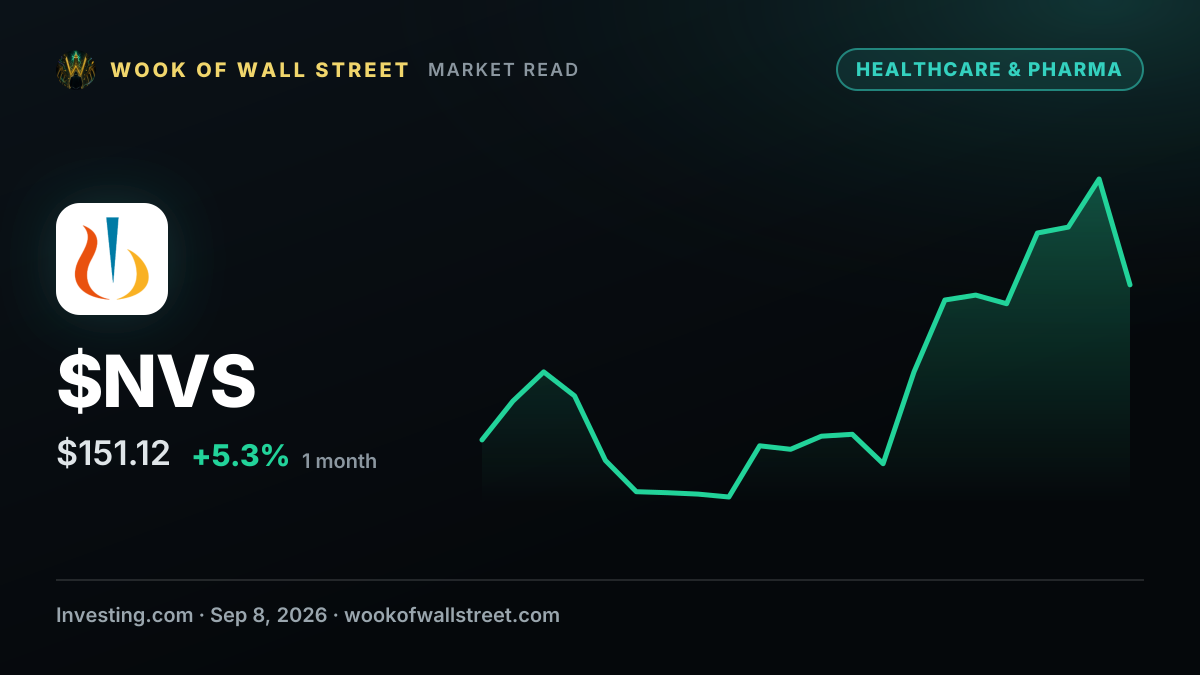
What it means
- What to watch: Risk signal in Markets — consider position sizing and correlated exposure.
- How the stock is trading: $NVS -3.30% in the latest session.
- Timing: It landed before the opening bell; the next session was the first that could react.
Where the stock stands
$NVS last traded at $151.12, -3.30% on the session. That is 11% below its 52-week high of $170.46 and 24% above its low of $121.57 — a little above the middle of the range. The year's range spans 40% from low to high: a moderate band. These are latest-session quotes, not live prices.
How much coverage it is getting
Wook has stored 6 stories about $NVS in the last 30 days, 0 of them this week. None arrived this week, so the run has gone quiet. Across those stories the wording ran 0% bullish, 100% neutral and 0% bearish; this one reads bearish, so it sits in a small minority of the run. 2 came from Investing.com and the rest from other outlets, so the coverage is broad rather than one desk returning to the story. 12 of them are listed beside this one.
The bigger picture
Market-wide stories are about the forces that move everything at once — rates, growth, inflation and appetite for risk — rather than one company, so their effect tends to show up in the indexes before it shows up in any single name. On Wook's supply-chain scanner, Health Care reads calm today — no unusual stress in the filings and disclosures it reads.
Coming up
$NVS earnings in 3 days. These were scheduled before this story and are not caused by it, but the nearest is close enough that the next hard numbers on this company will arrive soon.
What to watch next
The $NVS page has the full chart, the filings and the valuation model behind these figures. Comparing how two or three outlets frame the same story is the quickest way to separate the facts from the angle. Wook AI, above, can pull live figures and do the math — how far $NVS is from its high, or how this week's coverage compares — on request.
How this analysis was made
Investing.com published it, and Wook filed it under Markets. It reads bearish at medium severity because of “tumble” in the wording, with nothing on the bullish side to offset it. It was matched to $NVS. The publisher gave no preview text, and nothing has been written in to fill the gap.
The tone and severity labels come from a fixed word list — no editor, no AI — so they describe how a story is worded, not what happens next. They are not a forecast or a recommendation, and a same-day move does not mean this story caused it. Not investment advice.
Discussion
No one has weighed in yet. Start the discussion on this story.
What happened after this published
Investing.com published this on September 8, 2026. $NVS has moved +9.75% ($137.70 to $151.12). Measured from the first print available after publication, against the latest available quote. This comparison does not isolate the story's effect.