State Street My2030 High Yield Corporate Bond ETF declares monthly distribution of $0.1511
What it means
- What to watch: There is a hard number in this story ($0.1511) — the interesting part is how it compares with the last few like it.
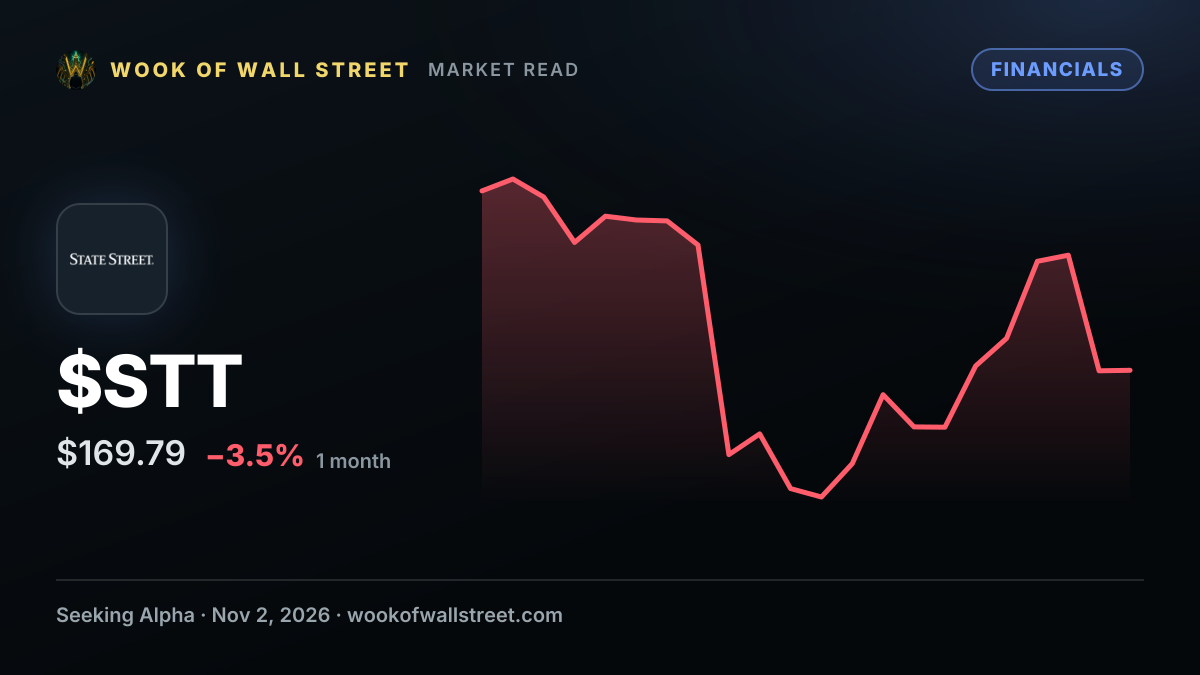
- How the stock is trading: $STT -0.01% in the latest session.
- Timing: It dropped mid-session, while New York was open, so the move beside it may already include the market's first reaction.
Where the stock stands
$STT last changed hands at $169.75, -0.01% on the session, 13% below its 52-week high of $195.93 and 52% above its low of $111.63 — a little above the middle of the range. Over the year it has ranged 76% from low to high: a wide band, so a several-percent week is just a week. These are latest-session quotes, not live prices — the live tape is on the $STT page.
How much coverage it is getting
Wook has logged 9 stories on $STT in the last 30 days, 4 of them this week. At its 30-day pace you would expect about 2 a week, so this week is running well ahead of normal — something has the newsroom's attention. Across those stories 3 read bullish, 6 neutral and 0 bearish. This one reads bullish, so it sits with a sizeable part of the run. 8 of the 9 (89%) came from Seeking Alpha itself, so the count says as much about how often Seeking Alpha hits publish as about how much attention there is — the other outlets are the better gauge. 12 related stories — same name or same desk — are lined up beside this one if you want the whole thread.
The bigger picture
Financial stories tend to turn on rates, credit and capital: what lenders earn on loans against what they pay on deposits, how many of those loans go bad, and how much capital the regulators insist on. On Wook's supply-chain scanner, Financials reads calm today — no unusual stress in the filings and disclosures it watches. The scanner equivalent of a quiet night shift.
Coming up
$STT earnings in 74 days. These were on the calendar before this story and are not caused by it.
What to watch next
The $STT page has the full chart, the filings and the valuation model behind every figure here. Because one outlet dominates the coverage, reading another outlet on the same story is the quickest check on whether it is being confirmed or just repeated. And Wook AI, up top, will happily do the math — how far $STT sits from its high, or how this week's coverage stacks up.
How this analysis was made
Seeking Alpha published it, and Wook filed it under Financials. It reads bullish at medium severity because of “high” in the wording, with nothing on the bearish side to offset it. It was matched to $STT. It carried $0.1511, shown as published and not recalculated. The publisher gave no preview text, and nothing has been written in to fill the gap.
The tone and severity labels come from a fixed word list — no editor, no AI, no crystal ball — so they describe how a story is worded, not what happens next. They are not a forecast or a recommendation, and a same-day move does not mean this story caused it. Not investment advice.
Discussion
No one has weighed in yet. Start the discussion on this story.
What happened after this published
Seeking Alpha published this on November 2, 2026. $STT has moved -0.33% ($170.32 to $169.75). Measured from the first print available after publication, against the latest available quote. This comparison does not isolate the story's effect.