Cummins Returned 512% in a Decade. Its Dividend Did Something Even More Impressive
What it means
- What to watch: The headline hangs on one number (512%) — one data point is a snapshot, so the trailing trend is the context it needs.
- How the stock is trading: $CMI -5.69% in the latest session.
- Timing: Weekend news: the change beside it is Friday's, and Monday's open is the first session that gets a say. Market holidays are not detected.
Where the stock stands
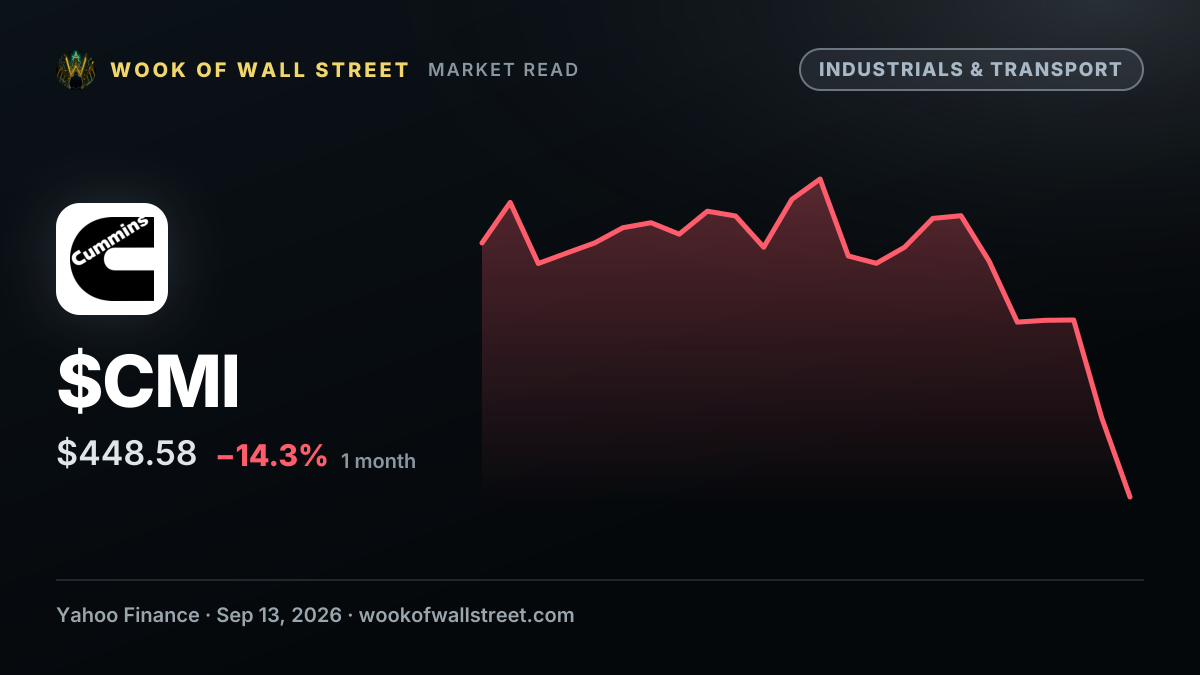
$CMI last changed hands at $444.97, -5.69% on the session, 40% below its 52-week high of $737.76 and 0.3% above its low of $443.62 — within a tenth of its 52-week low. Over the year it has ranged 66% from low to high: a wide band — moves of several percent in a week come with the territory. These are latest-session quotes, not live prices — the live tape is on the $CMI page.
How much coverage it is getting
In the last 30 days Wook has filed 2 stories about $CMI — 1 of them this week. At its 30-day pace you would expect less than one a week, so this week is running well ahead of normal; the press has found a reason to keep writing. Across those stories 1 read bullish, 1 neutral and 0 bearish. This one reads neutral, so it sits squarely with the crowd. 12 related stories — same name or same desk — are lined up beside this one if you want the whole thread.
The bigger picture
Industrial and transport stories are a read on the real economy — order books, freight volumes, backlogs and input costs — and they often show up here before they show up in the official data. On Wook's supply-chain scanner, Industrials reads elevated today.
What to watch next
For the receipts, the $CMI page has the full chart, the filings and the valuation model these figures come from. Want the facts without the spin? Read how two or three outlets frame the same story — where they agree is the news, where they differ is the angle. Wook AI, above, can pull live figures and run the numbers on request — how far $CMI is from its high, or how this week's coverage compares.
How this analysis was made
Yahoo Finance published it, and Wook filed it under Industrials & Transport. No strongly worded term either way, so it reads neutral at low severity — a factual headline rather than a charged one. It was matched to $CMI. It carried 512%, shown as published and not recalculated. The publisher gave no preview text, and nothing has been written in to fill the gap.
The tone and severity labels come from a fixed word list — no editor, no AI, no crystal ball — so they describe how a story is worded, not what happens next. They are not a forecast or a recommendation, and a same-day move does not mean this story caused it. Not investment advice.
Discussion
No one has weighed in yet. Start the discussion on this story.
What happened after this published
Yahoo Finance published this on September 13, 2026. $CMI has moved -17.77% ($541.10 to $444.97). Measured from the first print available after publication, against the latest available quote. This comparison does not isolate the story's effect.