Starwood Property earnings beat by $0.20, revenue topped estimates
What it means
- What to watch: $STWD cleared the bar by roughly $0.20; what the market makes of it usually depends on the guidance that came with it.
- How the stock is trading: $STWD -3.11% in the latest session.
- Timing: It came out pre-market, so the next session was the first that could react.
Where the stock stands
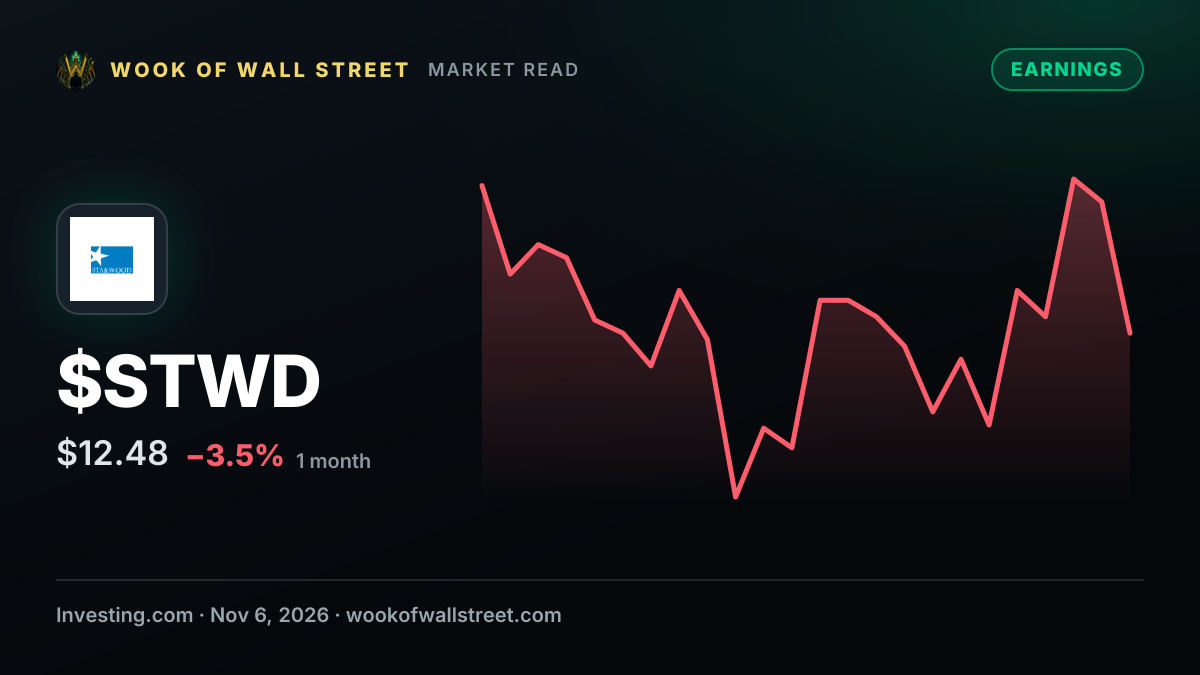
$STWD last traded at $12.48, -3.11% on the session. That puts it 33% shy of its 52-week high of $18.66 and 5.4% clear of its low of $11.84 — within a tenth of its 52-week low. Over the year it has ranged 58% from low to high: a wide band — moves of several percent in a week come with the territory. These are latest-session quotes, not live prices — the live tape is on the $STWD page.
How much coverage it is getting
Nothing else on $STWD in the last 30 days: this is the only story Wook has filed, so there is no run to measure it against yet. 12 related stories — same name or same desk — are lined up beside this one if you want the whole thread.
The bigger picture
With earnings, the number matters less than the number versus expectations — and guidance often matters more than both. A beat paired with a soft outlook can still get a cold reception. On Wook's supply-chain scanner, Real Estate reads watch today — early signs of strain worth keeping an eye on.
Coming up
$STWD earnings today. These were on the calendar before this story and are not caused by it, but the nearest is close enough that the next hard numbers on this company are almost here.
What to watch next
For the receipts, the $STWD page has the full chart, the filings and the valuation model these figures come from. Because one outlet dominates the coverage, reading another outlet on the same story is the quickest check on whether it is being confirmed or just repeated. And Wook AI, up top, will happily do the math — how far $STWD sits from its high, or how this week's coverage stacks up.
How this analysis was made
Investing.com published it, and Wook filed it under Earnings. It reads bullish at medium severity because of “beat” in the wording, with nothing on the bearish side to offset it. It was matched to $STWD. It carried $0.20, shown as published and not recalculated. The publisher gave no preview text, and nothing has been written in to fill the gap.
The tone and severity labels come from a fixed word list — no editor, no AI, no crystal ball — so they describe how a story is worded, not what happens next. They are not a forecast or a recommendation, and a same-day move does not mean this story caused it. Not investment advice.
Discussion
No one has weighed in yet. Start the discussion on this story.
What happened after this published
Investing.com published this on November 6, 2026. $STWD has moved -5.88% ($13.26 to $12.48). Measured from the first print available after publication, against the latest available quote. This comparison does not isolate the story's effect.