Mizuho raises Tandem Diabetes Care stock price target on Q3 beat
What it means
- What to watch: $TNDM got a new price target; the reasoning behind it says more than the number does.
- How the stock is trading: $TNDM +2.83% in the latest session.
- Timing: It came out pre-market, so the next session was the first that could react.
Where the stock stands
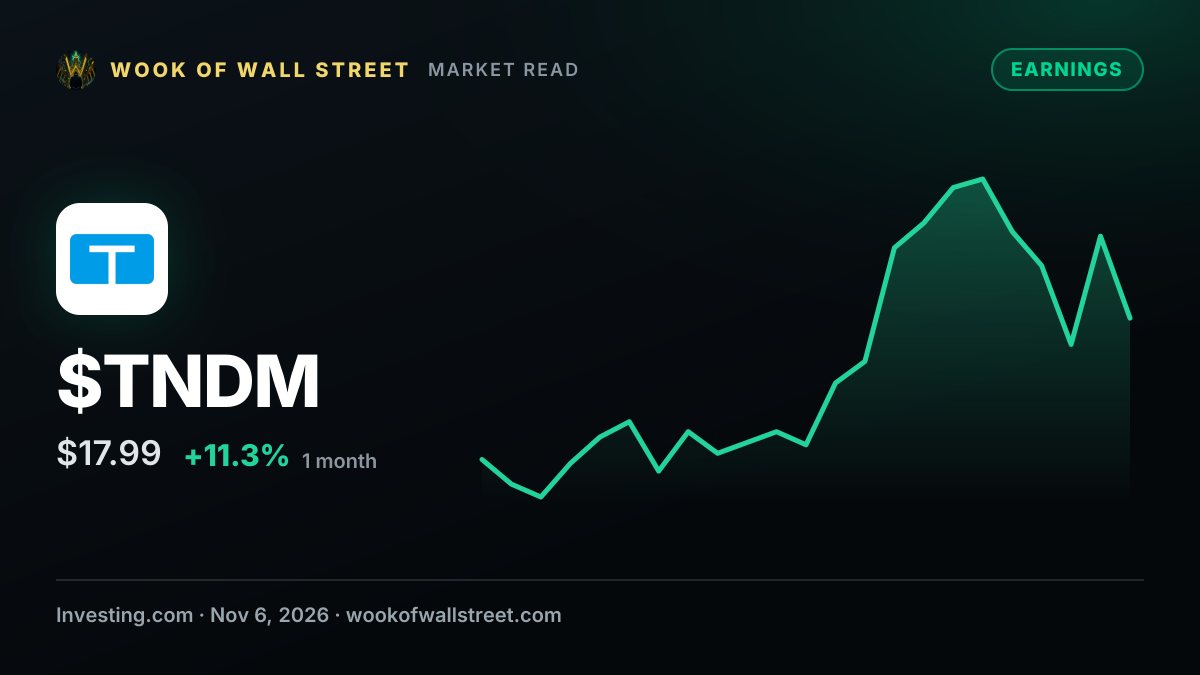
$TNDM last traded at $18.50, +2.83% on the session. That puts it 38% shy of its 52-week high of $29.65 and 51% clear of its low of $12.26 — a little below the middle of the range. Over the year it has ranged 142% from low to high: a very wide band — this one has spent the year on a roller coaster, and big swings are business as usual. These are latest-session quotes, not live prices — the live tape is on the $TNDM page.
How much coverage it is getting
In the last 30 days Wook has filed 2 stories about $TNDM — 2 of them this week. At its 30-day pace you would expect less than one a week, so this week is running well ahead of normal — something has the newsroom's attention. Across those stories 2 read bullish, 0 neutral and 0 bearish. This one reads bullish, so it sits in step with most of the run. This is the only one from Investing.com; the rest came from other outlets. 12 related stories from the same name or desk are listed beside this one.
The bigger picture
Earnings stories turn less on the headline numbers than on how they compare with what analysts expected, and on guidance for next quarter. A beat with weak guidance can land worse than a miss with a raised outlook — markets grade on the curve. On Wook's supply-chain scanner, Health Care reads watch today — early signs of strain worth keeping an eye on.
What to watch next
The $TNDM page has the full chart, the filings and the valuation model behind every figure here. Because one outlet dominates the coverage, reading another outlet on the same story is the quickest check on whether it is being confirmed or just repeated. Wook AI, above, can pull live figures and run the numbers on request — how far $TNDM is from its high, or how this week's coverage compares.
How this analysis was made
Investing.com published it, and Wook filed it under Earnings. It reads bullish at medium severity because of “beat” in the wording, with nothing on the bearish side to offset it. It was matched to $TNDM. The publisher gave no preview text, and nothing has been written in to fill the gap.
The tone and severity labels come from a fixed word list — no editor, no AI, no crystal ball — so they describe how a story is worded, not what happens next. They are not a forecast or a recommendation, and a same-day move does not mean this story caused it. Not investment advice.
Discussion
No one has weighed in yet. Start the discussion on this story.