Goldman Sachs flags 'frozen' institutional buyers amid tech de-risking
What it means
- What to watch: Lenders get judged on what goes bad: credit losses and reserve builds are the lines to watch.
- How the stock is trading: $GS -5.96% in the latest session.
- Timing: It landed during trading hours — the market got to read it live, so the session move beside it may already carry the reaction.
Where the stock stands
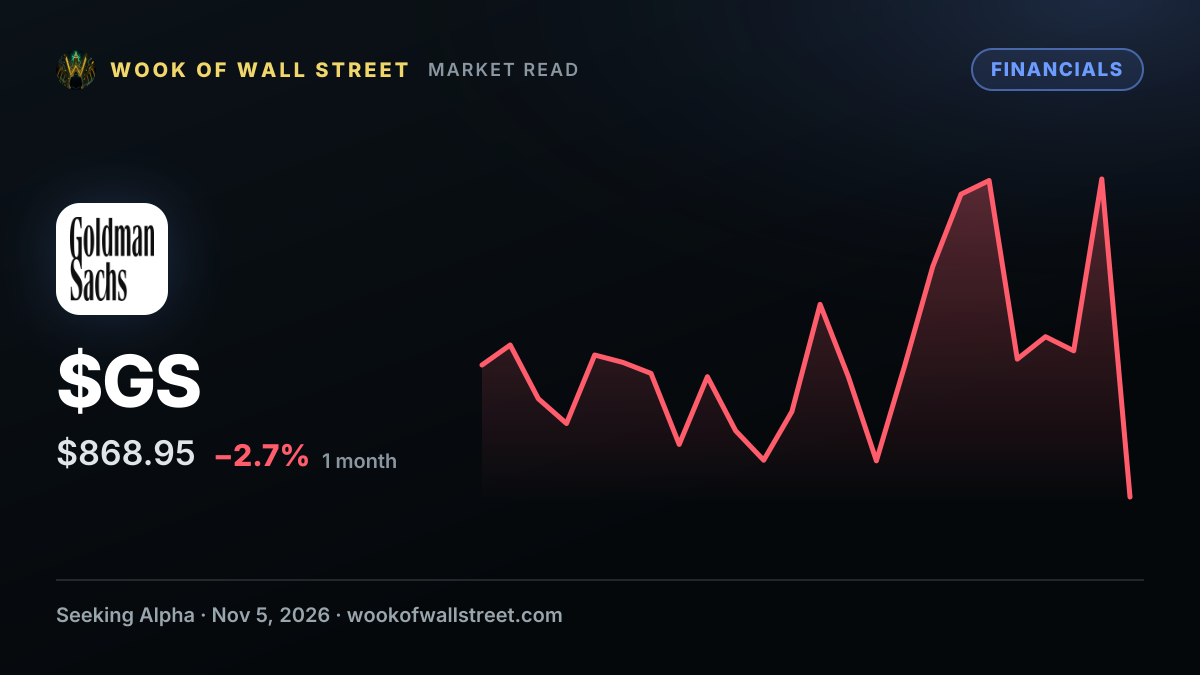
$GS last traded at $872.70, -5.96% on the session. That puts it 24% shy of its 52-week high of $1,153.99 and 16% clear of its low of $754.00 — in the lower part of the range. Over the year it has ranged 53% from low to high: a wide band, so a several-percent week is just a week. These are latest-session quotes, not live prices — the live tape is on the $GS page.
How much coverage it is getting
In the last 30 days Wook has filed 64 stories about $GS — 8 of them this week. At its 30-day pace you would expect about 15 a week, so this week is quieter than usual. Across those stories the wording ran 34% bullish, 55% neutral and 11% bearish. This one reads bearish, so it sits in a small minority of the run. 23 came from Seeking Alpha and the rest from other outlets — broad coverage, not one desk talking to itself. 12 related stories from the same name or desk are listed beside this one.
The bigger picture
Banks and lenders live on the spread — what they earn on loans versus what they pay for deposits — and get judged on how many of those loans sour and how much capital regulators make them hold. Wook's supply-chain scanner has Financials reading calm today: no unusual stress in the filings and disclosures it watches.
Coming up
$GS earnings in 75 days. These were on the calendar before this story and are not caused by it.
What to watch next
For the receipts, the $GS page has the full chart, the filings and the valuation model these figures come from. Comparing how two or three outlets frame the same story is the fastest way to separate the facts from the angle. Wook AI, above, can pull live figures and run the numbers on request — how far $GS is from its high, or how this week's coverage compares.
How this analysis was made
Seeking Alpha published it, and Wook filed it under Financials. It reads bearish at medium severity because of “risk” in the wording, with nothing on the bullish side to offset it. It was matched to $GS. The publisher gave no preview text, and nothing has been written in to fill the gap.
The tone and severity labels come from a fixed word list — no editor, no AI, no crystal ball — so they describe how a story is worded, not what happens next. They are not a forecast or a recommendation, and a same-day move does not mean this story caused it. Not investment advice.
Discussion
No one has weighed in yet. Start the discussion on this story.
What happened after this published
Seeking Alpha published this on November 5, 2026. $GS has moved +0.86% ($865.28 to $872.70). Measured from the first print available after publication, against the latest available quote. This comparison does not isolate the story's effect.